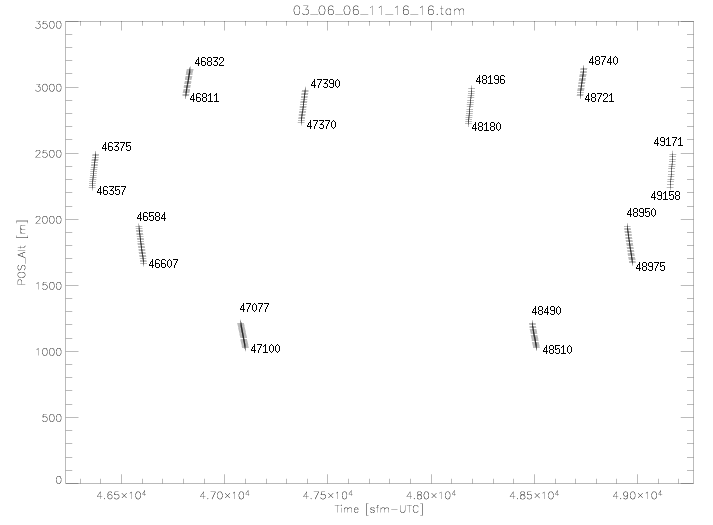
Figure 1: The aircraft altitude versus time
during the June 6, 2003 flight. Symbols are given every second for different
comparison time segments. The seconds from midnight are given for the
start and end of each segment.
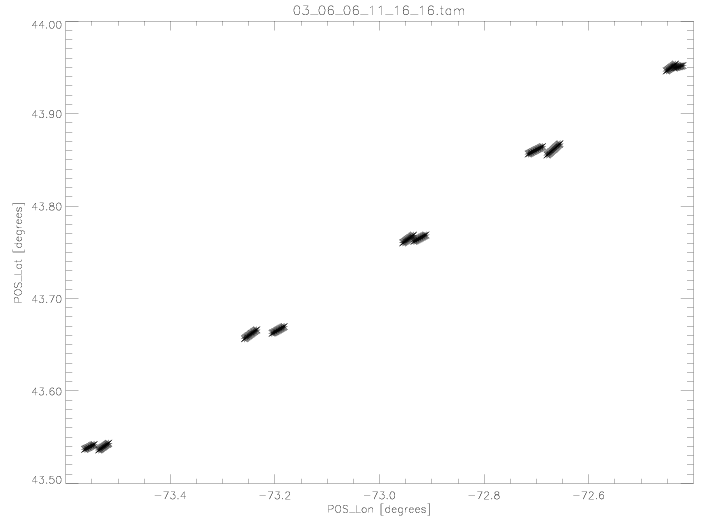
Figure 2: The aircraft's position (latitude
versus longitude) during the June 6, 2003 flight. Symbols are given
every second for the different comparison segments, which are over the same
time periods as given in Figure 1.
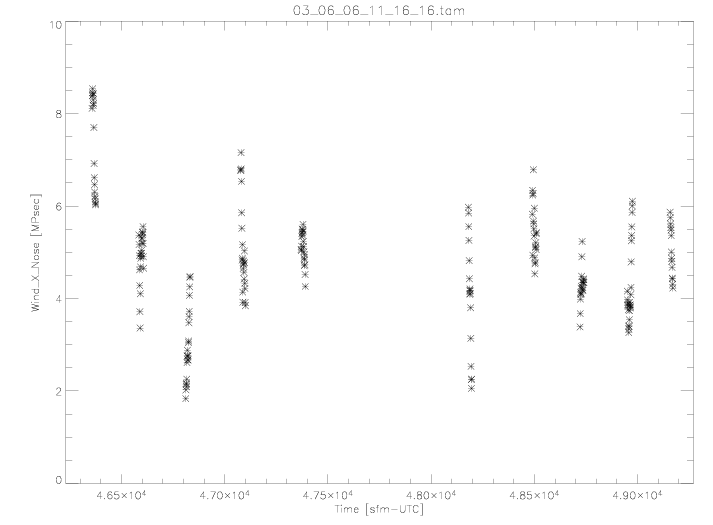
Figure 3: The X (East) component of the wind
versus time during the June 6, 2003 flight. Symbols are given every
second for the different comparison segments, which are over the same time
periods as given in Figure 1.
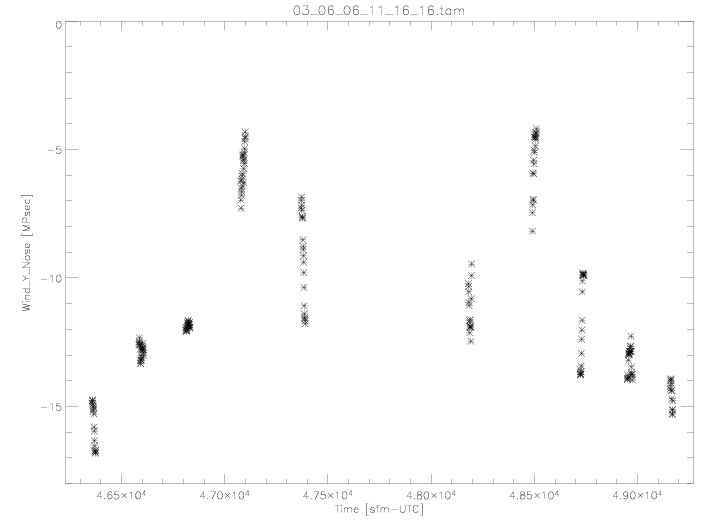
Figure 4: The Y (North) component of the wind
versus time during the June 6, 2003 flight. Symbols are given every
second for the different comparison segments, which are over the same time
periods as given in Figure 1.
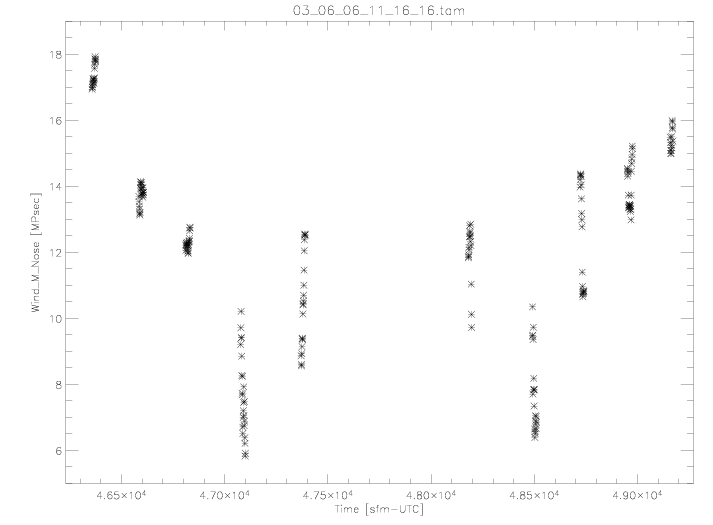
Figure 5: The magnitude of the wind versus
time during the June 6, 2003 flight. Symbols are given every second
for the different comparison segments, which are over the same time periods
as given in Figure 1.
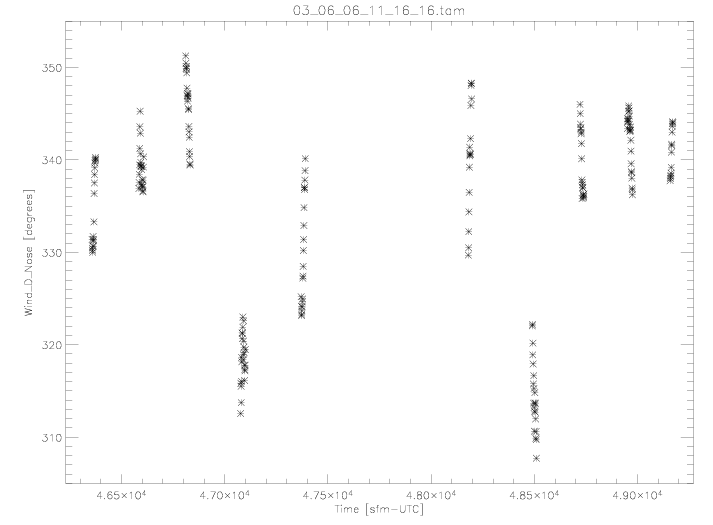
Figure 6: The wind direction versus time during
the June 6, 2003 flight. Symbols are given every second for the different
comparison segments, which are over the same time periods as given in Figure
1.