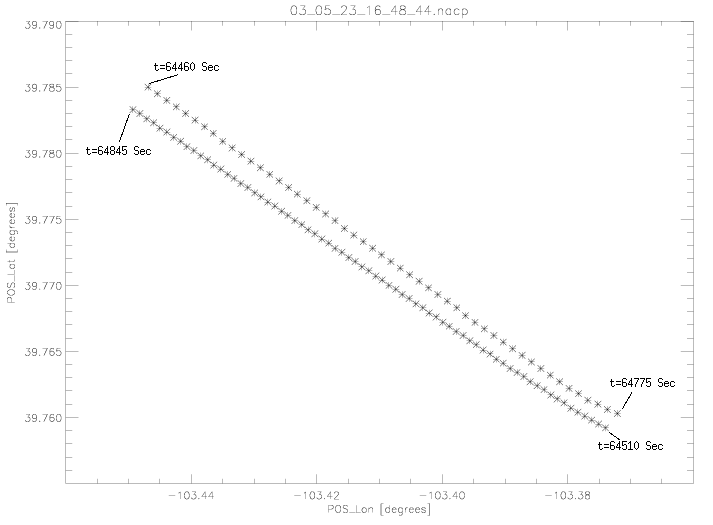
Figure 1: The aircraft's position (latitude
versus longitude) during comparison 2 on the May 23, 2003 flight. Symbols
are given every second for two time segments. The seconds from midnight
are given for the start and end of each time segment.
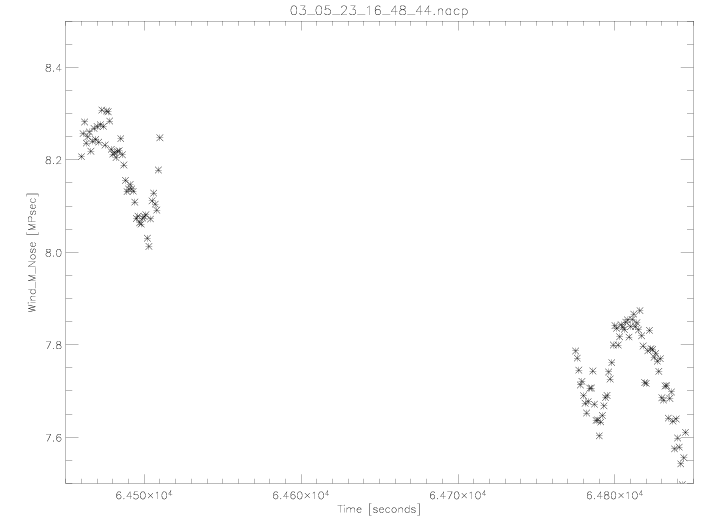
Figure 2: The wind magnitude versus time during
comparison 2 on the May 23, 2003 flight. Symbols are given every
second for the two time segments illustrated in Figure 1. The time
gap between the two segments is when the aircraft was turning around so
it could overfly the same location.
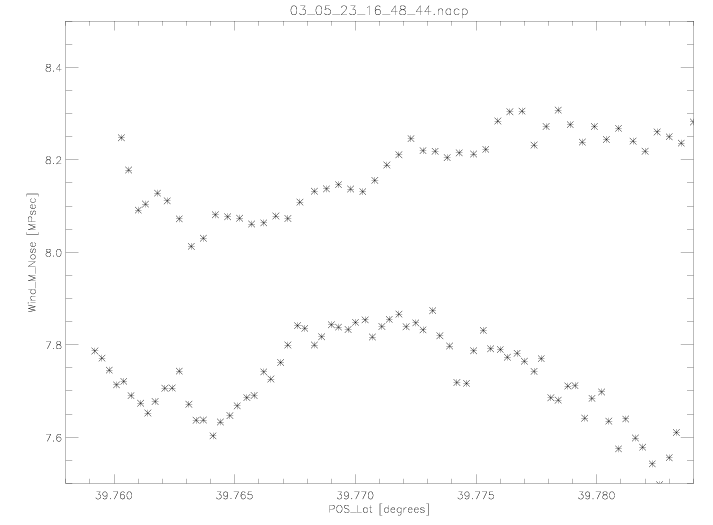
Figure 3: The wind magnitude versus latitude
during comparison 2 on the May 23, 2003 flight. Symbols are given every
second for the time segments illustrated in Figure 1.

Figure 4: The wind magnitude versus longitude
during comparison 2 on the May 23, 2003 flight. Symbols are given every
second for the time segments illustrated in Figure 1.
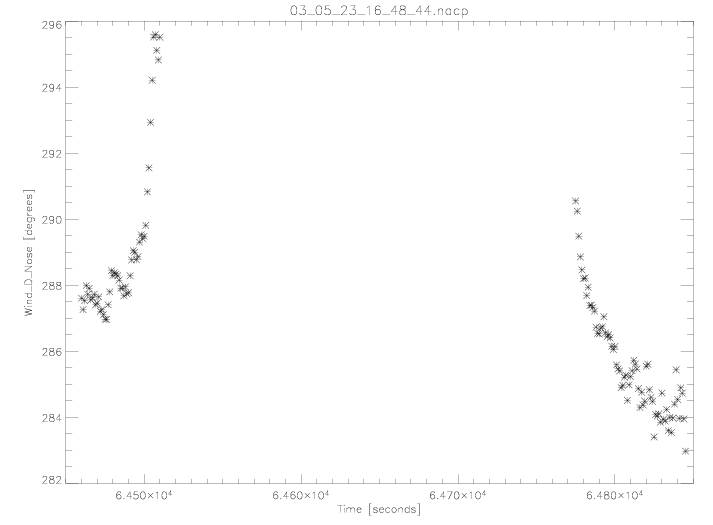
Figure 5: The wind direction versus time during
comparison 2 on the May 23, 2003 flight. Symbols are given every second
for the two time segments illustrated in Figure 1. The time gap between
the two segments is when the aircraft was turning around so it could overfly
the same location.
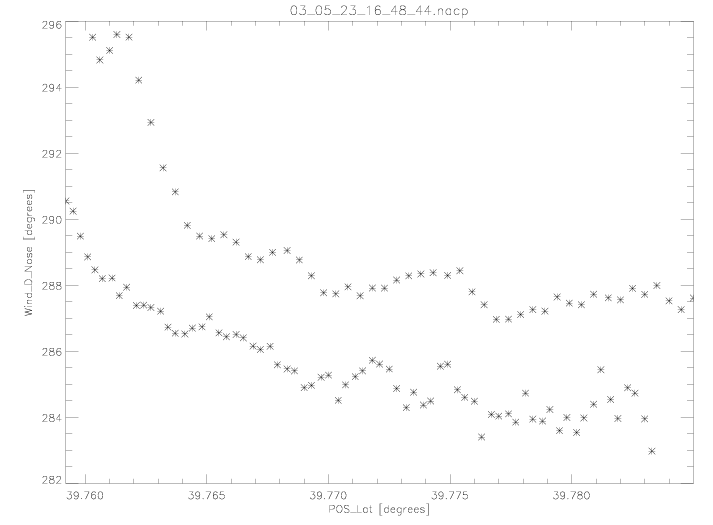
Figure 6: The wind direction
versus latitude during comparison 2 on the May 23, 2003 flight. Symbols
are given every second for the time segments illustrated in Figure 1.
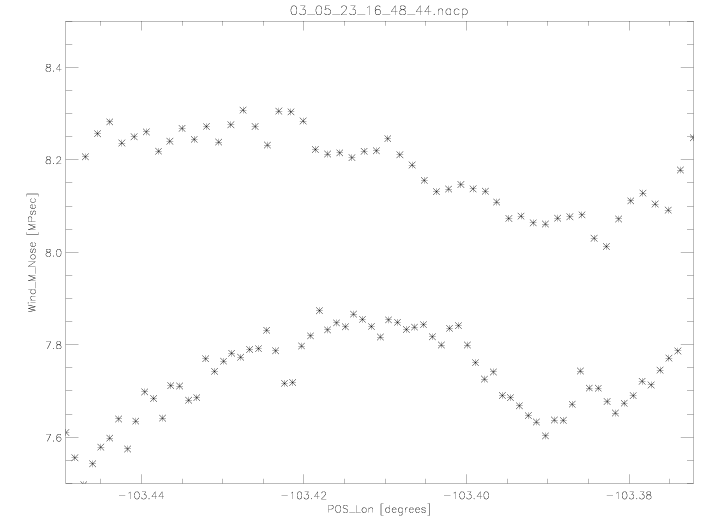
Figure 7: The wind direction versus longitude
during comparison 2 on the May 23, 2003 flight. Symbols are given every
second for the time segments illustrated in Figure 1.