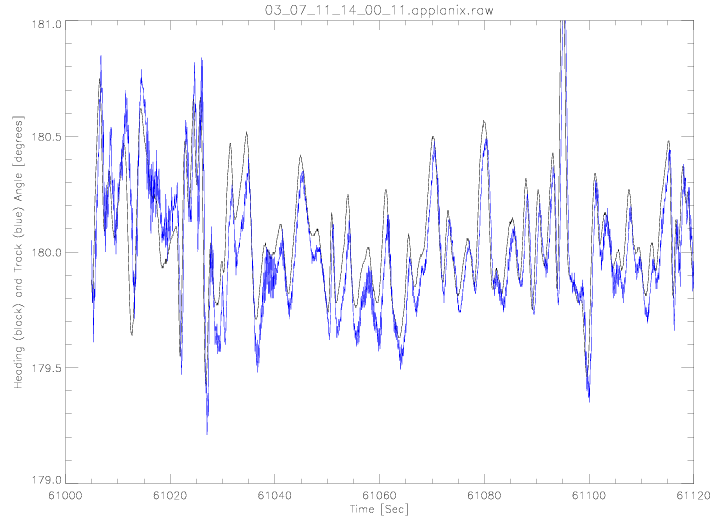
Figure 2: The aircraft's heading (black line)
and track angle (blue line) versus time for taxies segment 2 on July 11,
2003 using the real time data files.
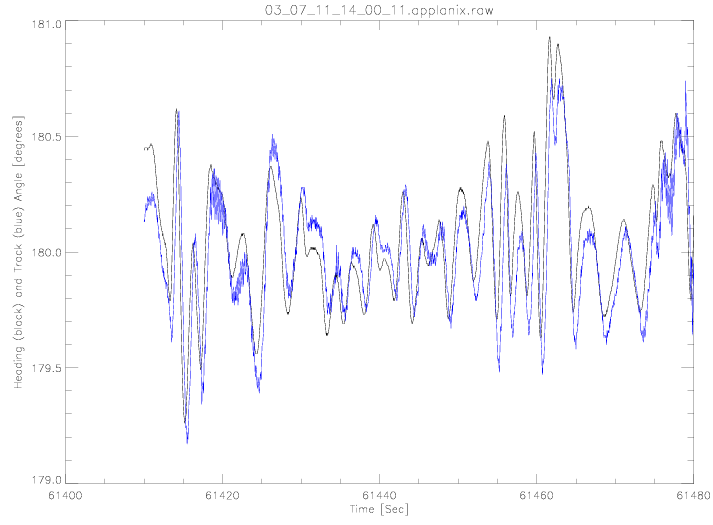
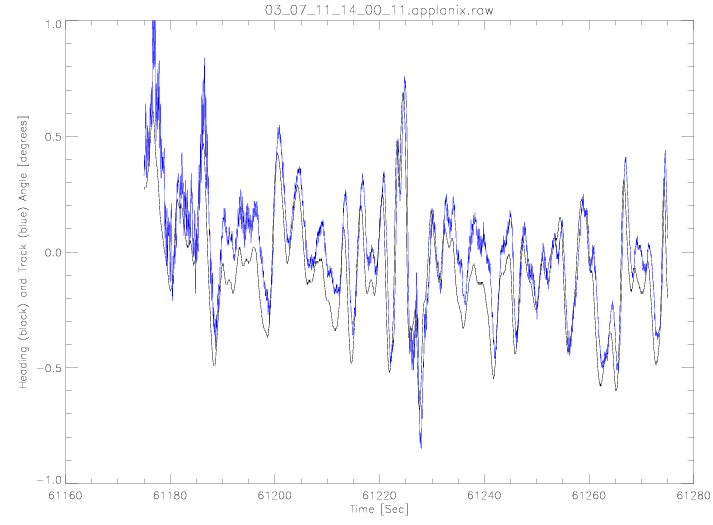
Figure 3: The aircraft's heading (black line)
and track angle (blue line) versus time for taxies segment 3 on July 11,
2003 using the real time data files.
Segment Number
|
Heading Angle
|
Track Angle
|
Heading Angle - Track Angle
|
1
|
180.07111
|
180.01495
|
0.056157858
|
2
|
-0.08130
|
0.016070
|
-0.09737
|
3
|
180.05413
|
179.99825
|
0.055882353
|
Table 1: Summary of the time segments for
the taxies on July 11, 2003 using the real time data files.
The heading angle offset is calculated as follows.
The heading angle minus track angle value is averaged for segment
1 and 3 and subtract from the magnitude of segment 2 and then divided by
2. This gives a heading angle offset of 0.0206764 degrees. Using
0.0206764 degrees as the heading angle adjustment, the mean difference
between the heading and track angle for segment 1 would be 0.0768 degrees
and for segment 2 it would be -0.0767 degrees. They are equal but
have different signs. The reason that both values are not equal to
zero is due to a cross wind on the aircraft that has a small affect even
on the runway.
Since the taxies segment plots (Figures 1-3) do not show any
systematic bias in the heading angle relative to the track angle, we will
assume the calculated heading angle offset is due to noise in the measurement
and will take the heading offset to be 0.0 degrees. Any change in
the heading offset values needs to be updated in the "citation_constants.pro"
software routine before proceeding with the rest of the calibration steps.
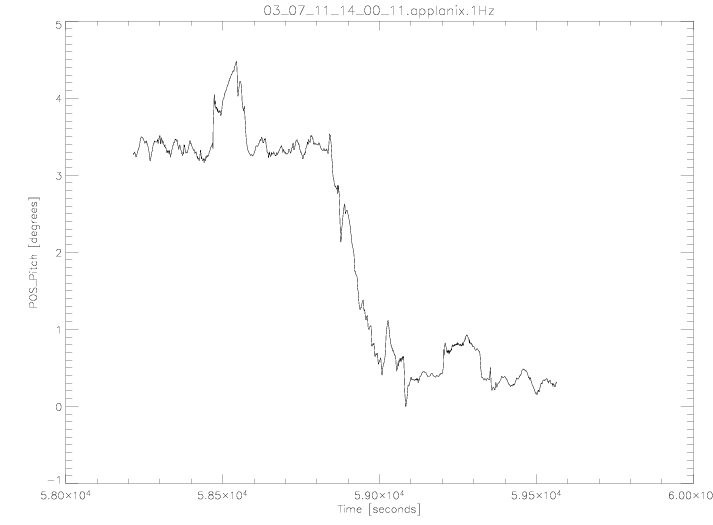
Figure 4: The aircraft's pitch angle versus
time for the time period of the alpha angle calibration on July 11, 2003.
Note that this was done at a constant altitude of approximately 9000
meters.
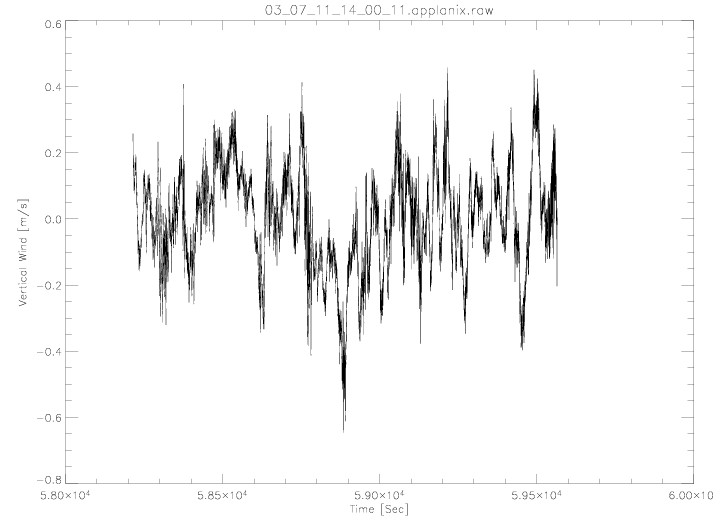
Figure 5: The vertical wind versus time for
the time period of the alpha angle calibration on July 11, 2003.
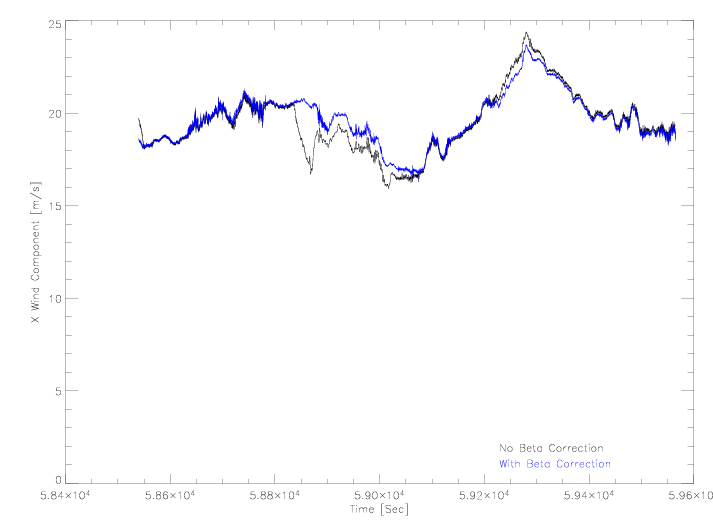
Figure 6: The X (East) component of the wind
versus time for the time period of the beta angle calibration on July 11,
2003. The black line is for no beta angle correction; where as, the
blue line includes a beta angle correction in wind calculation.
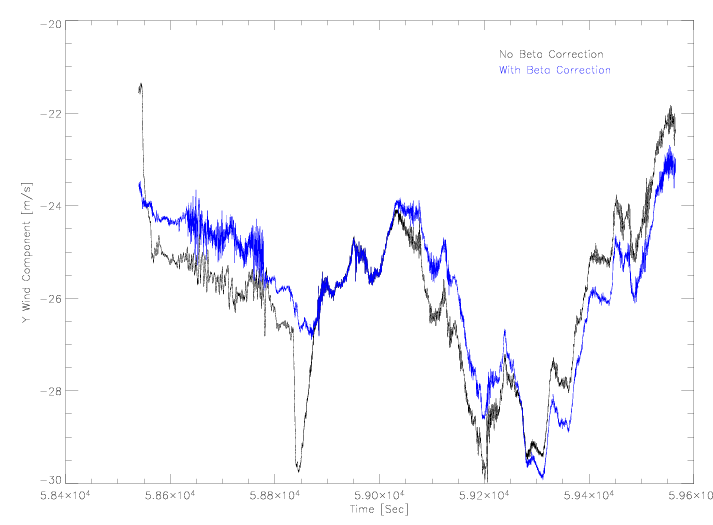
Figure 7: The Y (North) component of the wind
versus time for the time period of the beta angle calibration on July 11,
2003. The black line is for no beta angle correction; where as, the
blue line includes a beta angle correction in wind calculation.